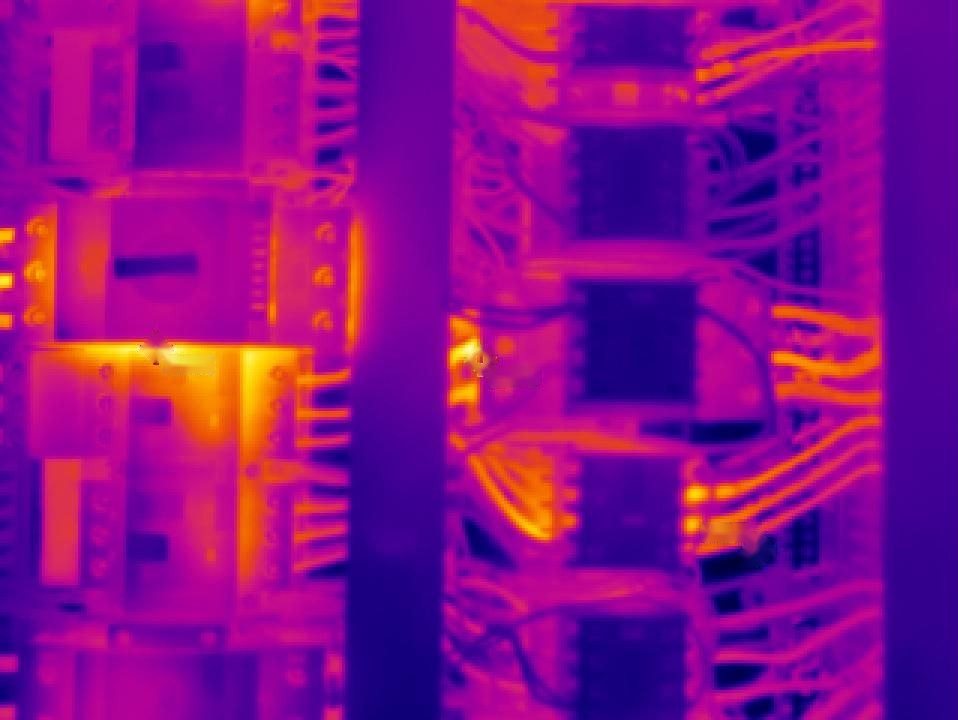
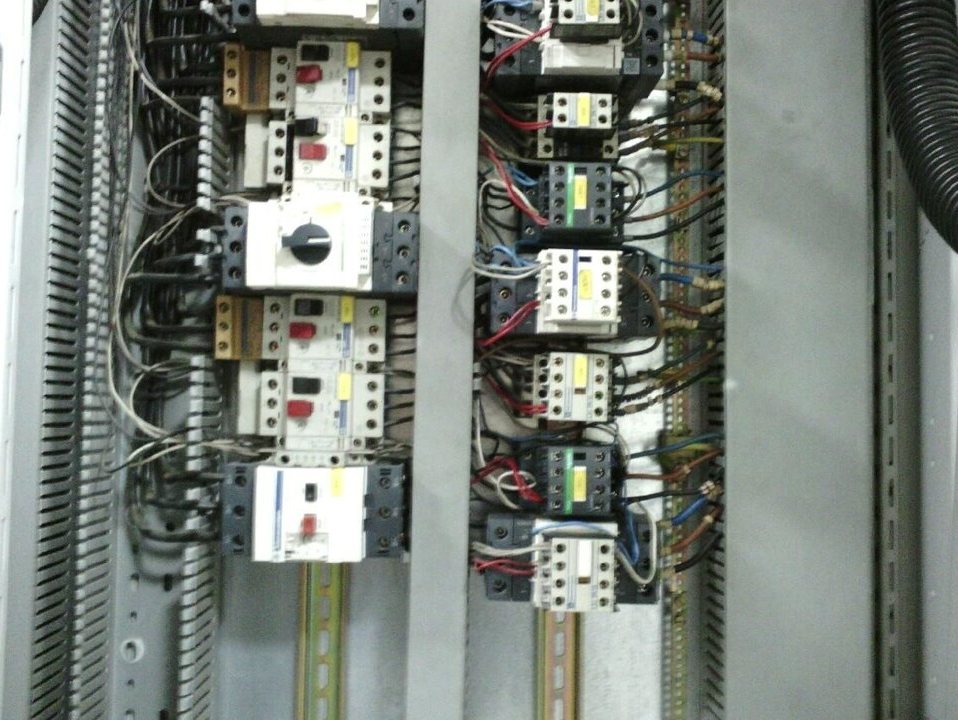
Electrical panel
One termination hotter than the rest points to a loose or corroded connection long before it fails

Stage 2 of 4: See
A calibrated thermal camera shows what the eye cannot: connections running hot, compressors and oil separators out of their normal range, cold lines losing insulation and doors leaking — every finding is logged with a temperature rise and a severity
Figures on this page are typical or illustrative ranges from our method, not audited results for a named site — your own baseline sets the real numbers
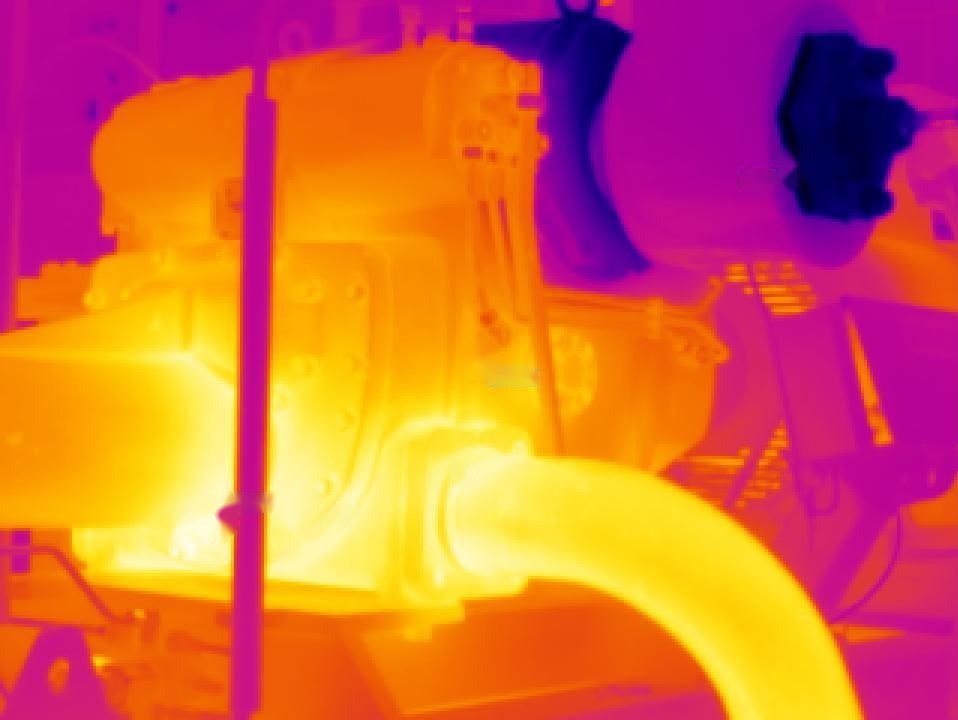
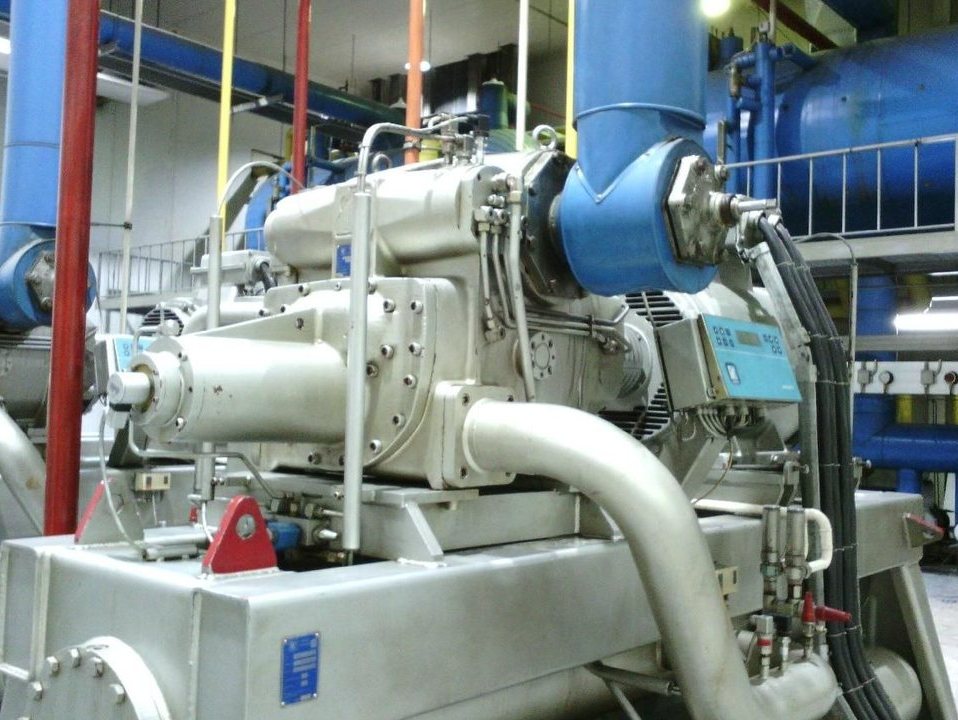
Drag the slider — on the left is what you see on a walk-round — on the right is what the camera reads from the same spot, with temperature on every pixel
One termination hotter than the rest points to a loose or corroded connection long before it fails
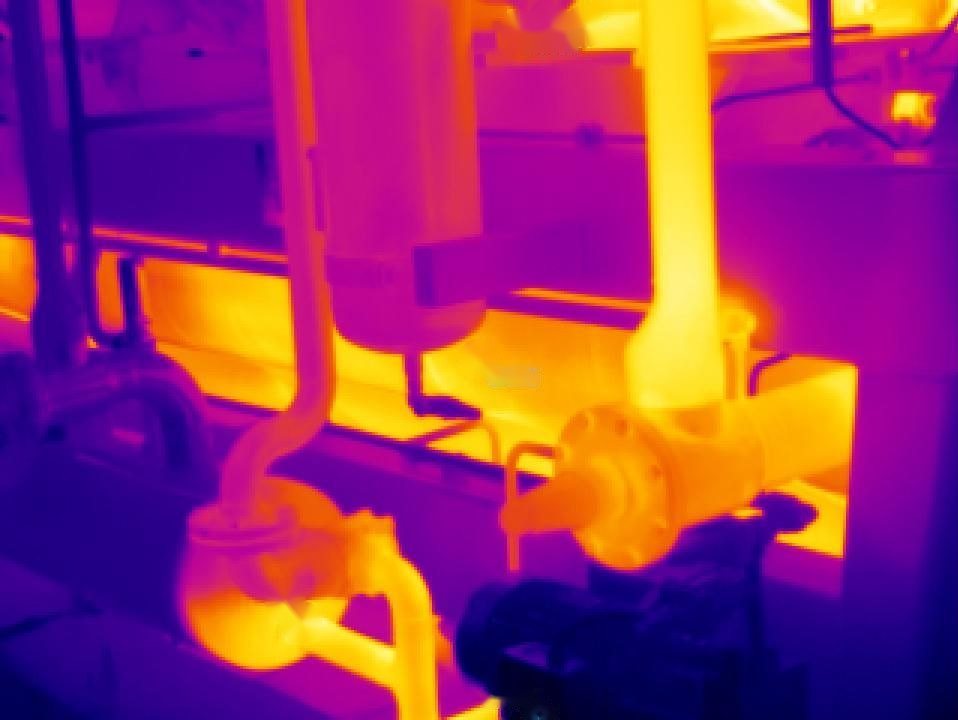
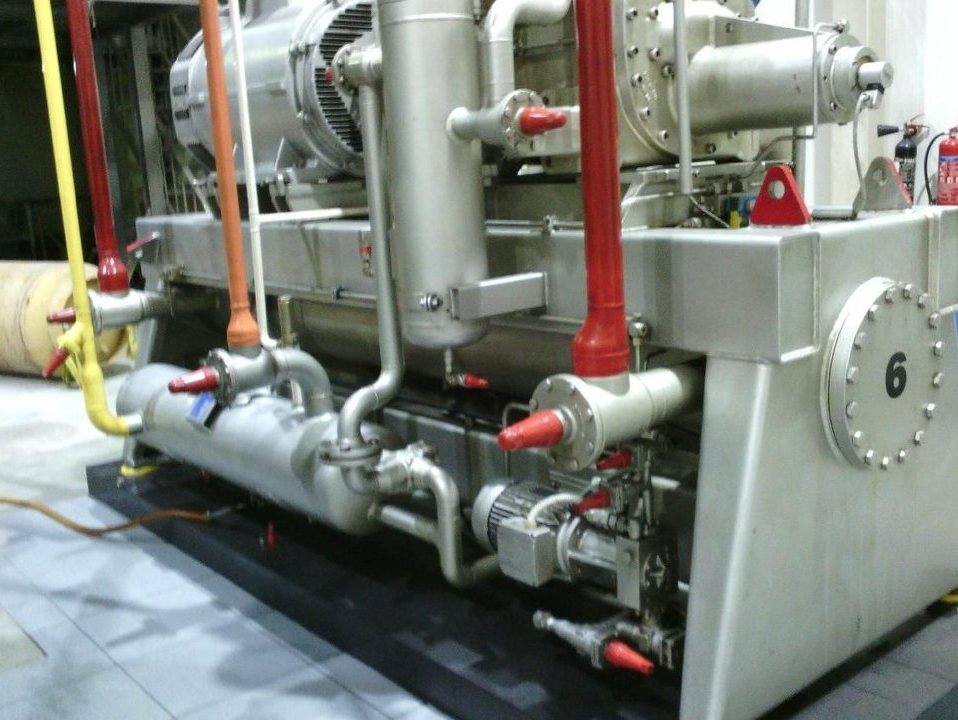
Oil level and discharge-side temperature, read through the shell with no contact
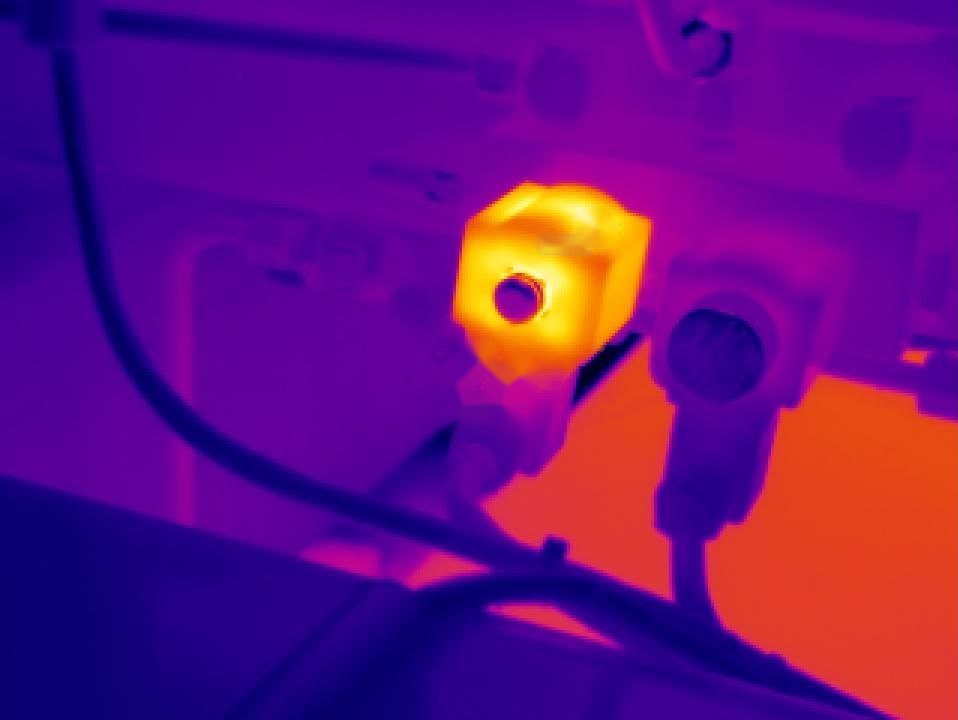
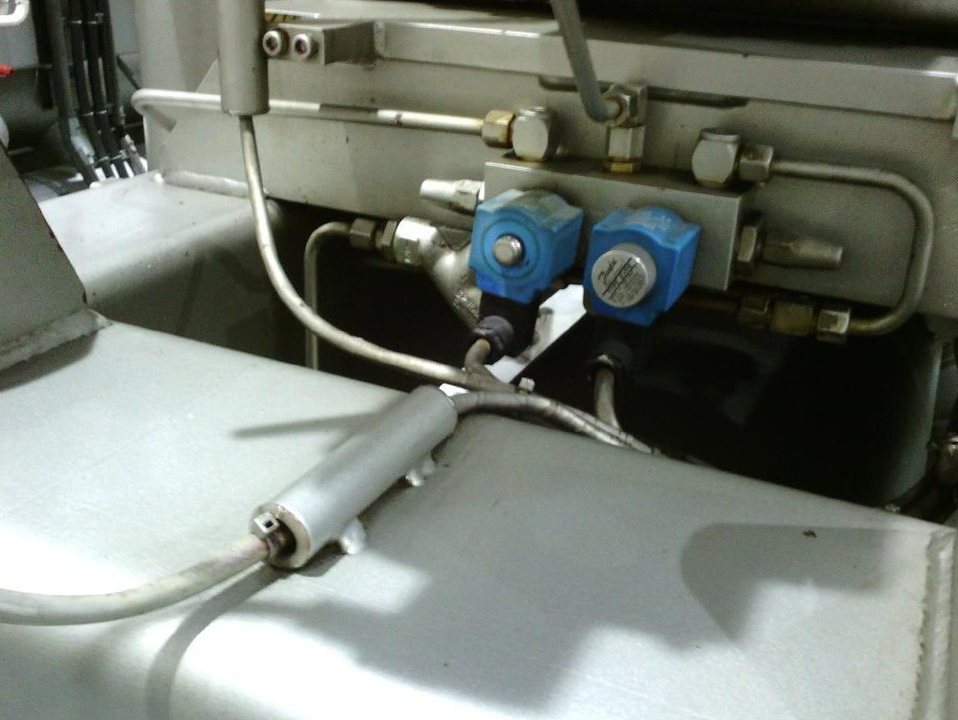
Where a cold line leaves its insulation, the camera shows exactly how many metres are exposed
Terminals, breakers, busbars and phase imbalance
Housings, bearings, couplings and oil separators
Suction and liquid lines, valves, flanges and insulation gaps
Panel joints, door seals, floor and roof interfaces
Coil blockage and uneven airflow across the face
Frost pattern, uneven defrost and fan problems
We pick the hour when load is normal, because a cold plant hides faults
Radiometric images paired with a visible-light photo of every finding
Temperature rise over a reference, compared with similar components, then a severity
Findings ranked by cost of inaction, each with a fix and an owner
Failure or fire risk — act at the next safe window, then rescan
Losing money every day — schedule the fix and track it
Inside range today — added to the re-survey list
Clamp-on meters on the incomer and the big loads — no shutdown, no rewiring
Output Load profile and a baseline
A radiometric thermal camera finds hot connections, cold-line losses and leaking envelope
Output Ranked findings with images
Setpoints, sequencing, defrost and fan control corrected one change at a time
Output Lower runtime, fewer starts
The same meters run again — savings are measured against the baseline and normalised
Output A saving figure you can defend
No — it reads surface temperature only — for panels, the covers are opened by your electrician under normal permit rules so the components are in view
It needs to be running at normal load — a lightly loaded panel or idle compressor will hide the faults we are looking for
It depends on the component, the current and the reference — we rank by temperature rise over a similar healthy part and the manufacturer’s limits, not by a single universal number
Quarterly under Continuous Monitoring, or annually for a stable site — after any major repair we rescan that item
Book a free assessment
One call of about twenty minutes — we work out whether there is enough on the table to justify a site visit, and tell you plainly if there is not