Most of a cold store’s bill is refrigeration, and so is most of the waste
In a typical food cold store, well over half of the electricity goes to the refrigeration plant — that plant rarely runs the way it was commissioned — we close that gap
Typical split for a UAE chilled and frozen store — your own metering replaces these with real numbers
55%
12%
12%
8%
13%
Compressors 55%
Condenser fans 12%
Evaporator fans 12%
Defrost 8%
Lighting, docks, other 13%
Per cent of site electricity, typical, illustrative Figures on this page are typical or illustrative ranges from our method, not audited results for a named site — your own baseline sets the real numbers
Follow the heat through the plant
The story of a cold store runs in a circle — here it is in the order the refrigerant meets each part
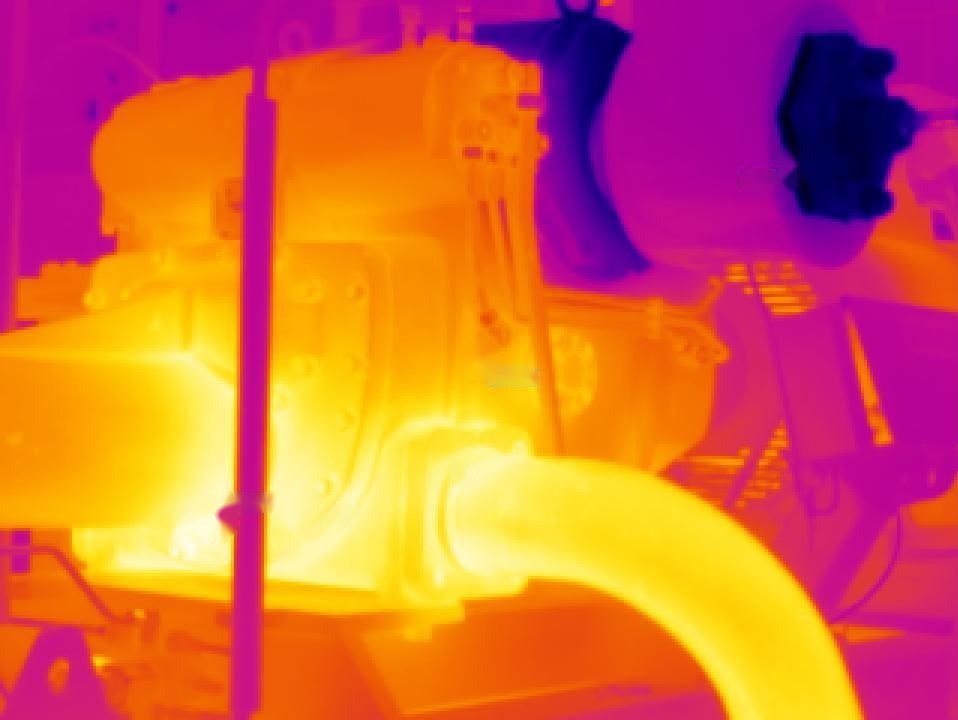
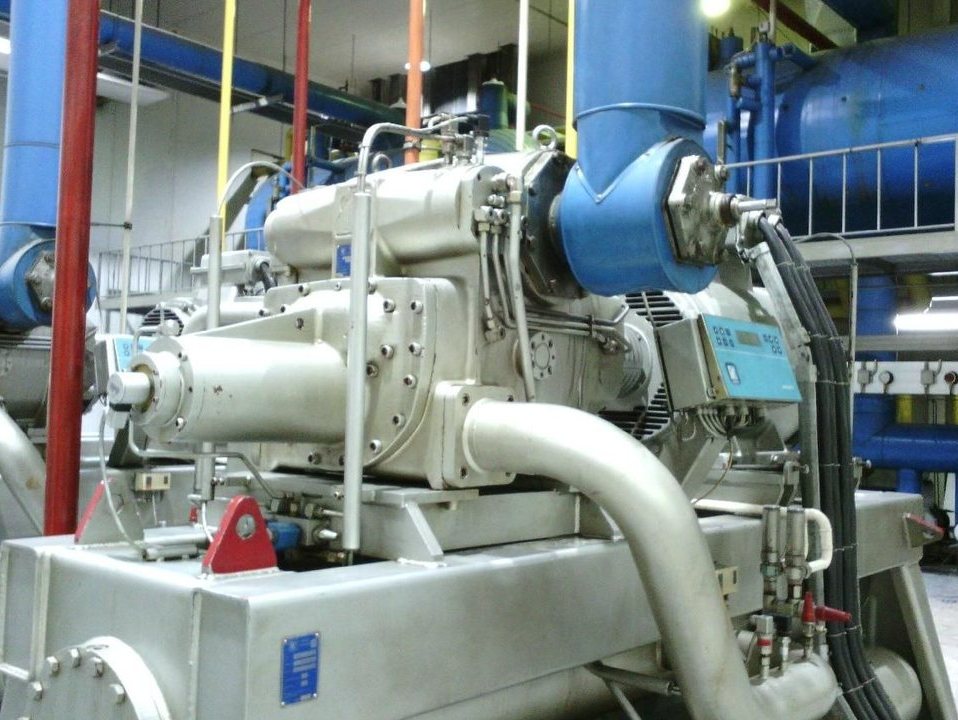
Visible lightInfrared
01
The compressor
The largest single load — its start count and running pressure decide both the bill and its lifespan
02
The cold store
Every door opening and failed seal lets warm, humid air in — that moisture becomes frost
03
The condenser
Throws the heat outside — a dirty coil or a fixed setpoint makes the compressor work harder
Visible lightInfrared
04
Compressor sequencing
Back at the compressors: which one runs, at what load, and how often it starts
05
The evaporator
Frost on the coil blocks heat pickup, so the plant runs longer to do the same job
Visible lightInfrared
06
The thermal camera
Makes all of the above visible in one walk-round, with temperatures on every pixel
07
Optimisation
Corrections made one at a time, verified against the baseline
Every cold store is a loop — the evaporator pulls heat out of the room, the compressor lifts it to a higher pressure, the condenser throws it outside and the cycle starts again — each stage can waste energy in its own way
1
Cold store
Product, panels and doors — heat leaks in through every gap
Worn door seals, open dock doors and degraded panel joints let warm, humid air in — it turns to frost and the plant works harder all day
What we do Thermal-camera envelope scan, seal repair, door interlocks
2
Compressor
Lifts refrigerant pressure — the biggest electrical load on site
Poor sequencing means machines start and stop far more than needed, run partly loaded, or run against a higher pressure than the day requires
What we do Staging and sequencing review, suction pressure reset, start counting
3
Condenser
Rejects heat to outdoor air — fans and coils set the head pressure
Fouled coils, blocked airflow and a fixed head-pressure setpoint push compressor power up, most of all on cooler nights when it could be lower
What we do Coil cleaning, fan control, floating head pressure
4
Evaporator
Coil and fans inside the room that absorb heat from the air
Frost on the coil, timer-based defrost and fans that never slow down add heat to the room and then charge you to remove it
What we do Demand-based defrost, fan control, superheat check
Typical sources of waste, and what we do about each
These are the findings we expect to meet in a UAE cold store — impact ranges are typical, not promised: your meters decide
Refrigerant leaks and frost on evaporators
What it looks like
Coils icing up, long runtimes, rising superheat, room slow to pull down
What we do
Leak check and charge verification, demand-based defrost, airflow check
Typical impact Capacity loss and extra runtime
Condenser fouling and air starvation
What it looks like
Head pressure and discharge temperature higher than they should be on a normal day
What we do
Coil cleaning, recirculation fix, fan staging
Typical impact Compressor power up with every degree of extra condensing temperature
Floating head pressure not used
What it looks like
Condensing pressure fixed all year, even on cool nights
What we do
Enable and tune ambient-following head pressure within manufacturer limits
Typical impact Roughly 2 to 3 per cent compressor power per degree of reduction
Compressor sequencing
What it looks like
Several machines part-loaded, frequent starts, cycling around the setpoint
What we do
Re-stage, widen the differential, add minimum run and off timers
Typical impact Fewer starts per hour, less wear
Door seals and dock infiltration
What it looks like
Frost around doors, fogging, warm patches in the thermal image
What we do
Seal repair, strip curtains, door interlocks, dock shelters
Typical impact Less latent load and less frost
Defrost schedules
What it looks like
Defrost on a fixed timer, heaters on after the coil is already clear
What we do
Move to demand or temperature termination and retime to off-peak
Typical impact Less heater energy, less heat dumped into the room
Loose terminals and hot connections
What it looks like
Connections running hotter than their neighbours on the thermal scan
What we do
Re-torque and repair at the next safe window, rescan to confirm
Typical impact Fire and unplanned-outage risk, plus resistive loss
Evaporator fans running at full speed
What it looks like
Fans at 100 per cent all day regardless of load
What we do
Temperature or demand-based fan control
Typical impact Fan power and fan heat both fall
Peak demand ignored
What it looks like
Pull-down, defrost and washdown all landing in the same hour
What we do
Re-time heavy loads outside the tariff peak
Typical impact Lower demand charges with no change in kWh
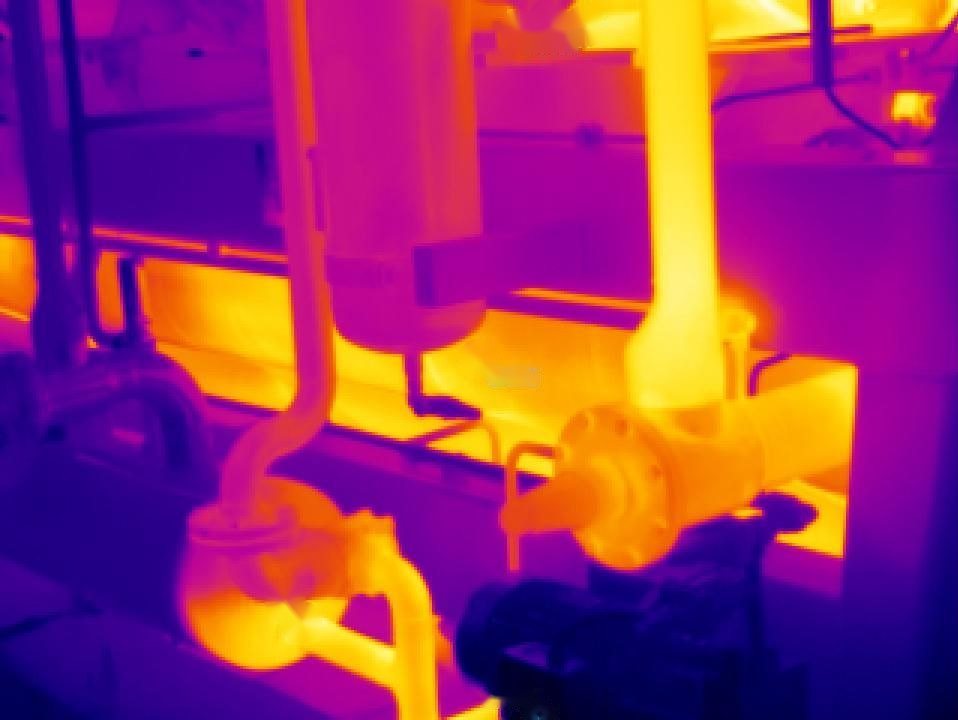
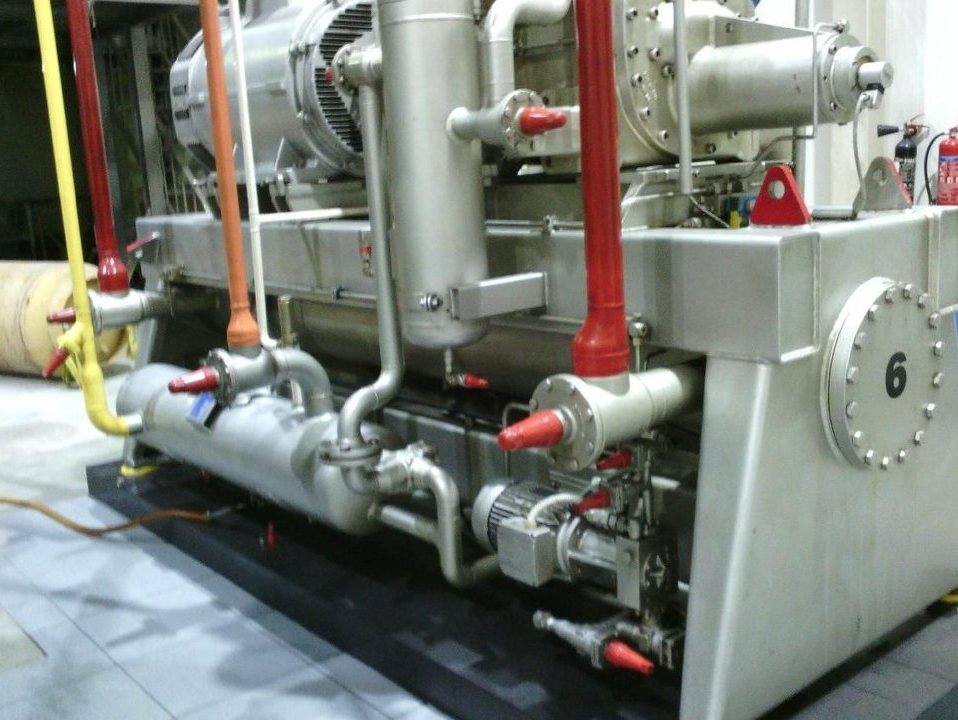
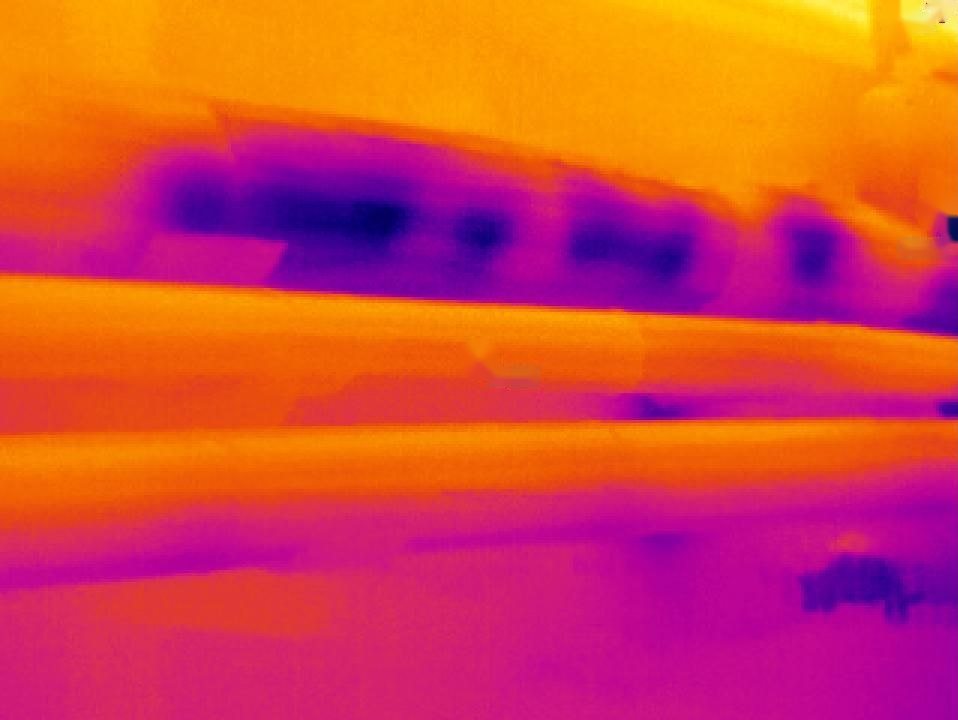
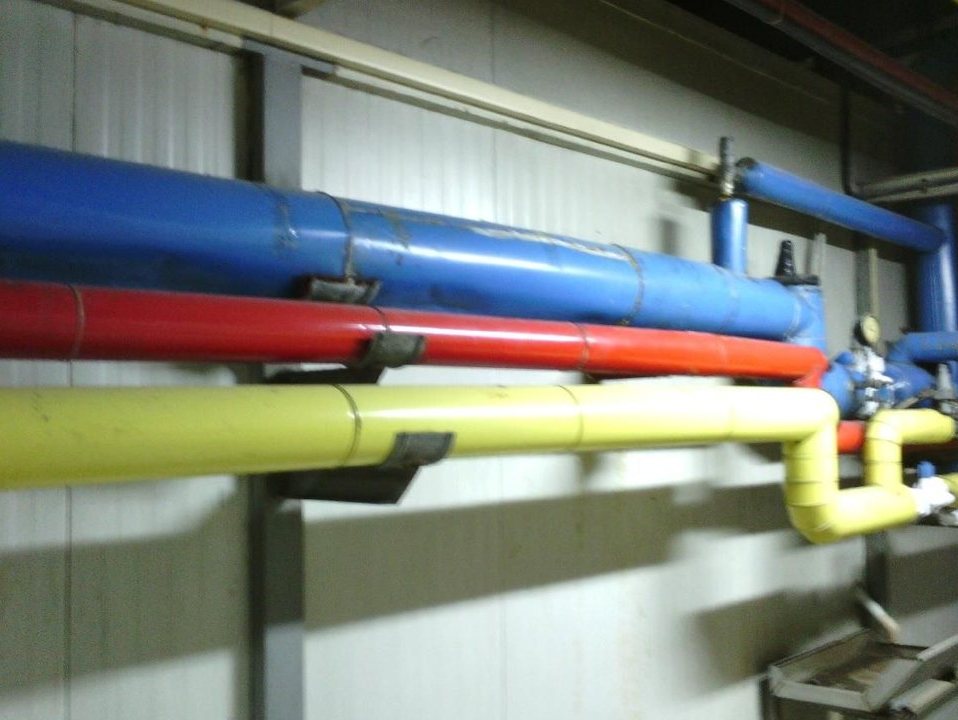
The camera shows what the walk-round misses
Pipework that looks fine in daylight can be shedding cold along its whole length — drag to see the difference
Energy gets the attention, but the mechanical outcome is often worth more — fewer starts, lower discharge temperature and a lower pressure ratio are what extend overhaul intervals
Fewer starts per hour
Proper staging and sequencing cut the stress cycles that wear contactors and bearings
Cooler discharge
Clean condensers and the right charge keep discharge temperature down
Lower pressure ratio
Floating head pressure lets the compressor work against less
Early warning
Thermal trending flags bearings and motors before they fail
A worked example
A 6,400 cubic metre frozen store with four compressors — illustrative figures, normalised for ambient temperature and stored volume
Typical paybackabout 4 months
Pharma and temperature-critical rooms
For validated cold rooms, product safety comes first — we never change anything inside a qualified range without your quality team’s approval, and use metering and thermography mainly to find waste in the plant around the room
Before After
Compressor starts per hour
9 →3
Night baseload
100 →69
Monthly consumption
100 →69
Illustrative worked example — index, before = 100 (starts shown as counts)
Built for sites where refrigeration is the biggest line on the bill
The physics is the same everywhere — the load, the doors and the hours are not
Frozen food
Blast freezers, low-temperature stores, dock areas
Dairy
Process cooling, chilled water and CIP cycles
Meat and poultry
Chilling, cutting halls and cold-chain distribution
Pharma cold rooms
Validated 2 to 8 °C rooms where stability matters more than anything
Logistics hubs
Multi-temperature warehouses with constant door traffic
Questions we hear first
Does the survey interrupt production?
No — metering uses clamp-on sensors and the thermal survey is contactless — in fact the plant has to be running under normal load for the readings to mean anything, so we plan around your shifts, including nights
How long does an assessment take?
One to three days on site depending on size, then five to seven working days to deliver the report — a permanent monitoring install takes about half a day
Do you sell equipment?
No — we are not tied to any manufacturer — many of the savings we find need no purchase at all: setpoints, schedules, control logic and seals — when hardware is justified we say so and you buy it from whoever you prefer
What if you find nothing worth fixing?
Then we tell you on the first call, before anyone visits — under Shared Savings the question never arises, because no verified saving means no fee
Is our data kept confidential?
Yes — your data stays on your dashboard and is never shared — we will sign an NDA before the first site visit if you ask
Which areas do you cover?
The whole UAE: Dubai, Abu Dhabi, Sharjah, Ajman, Ras Al Khaimah, Al Ain and Fujairah — we travel to site
Book a free assessment
Find out what your plant is wasting
One call of about twenty minutes — we work out whether there is enough on the table to justify a site visit, and tell you plainly if there is not