CutWatt meters your supply in real time, surveys the facility with a thermal camera,
and corrects the refrigeration plant behind the waste. Cold stores and factories
typically cut consumption by a fifth to a third — and their compressors last longer for it.
No production stoppage
Report in 5 working days
Vendor-independent
--.-°C
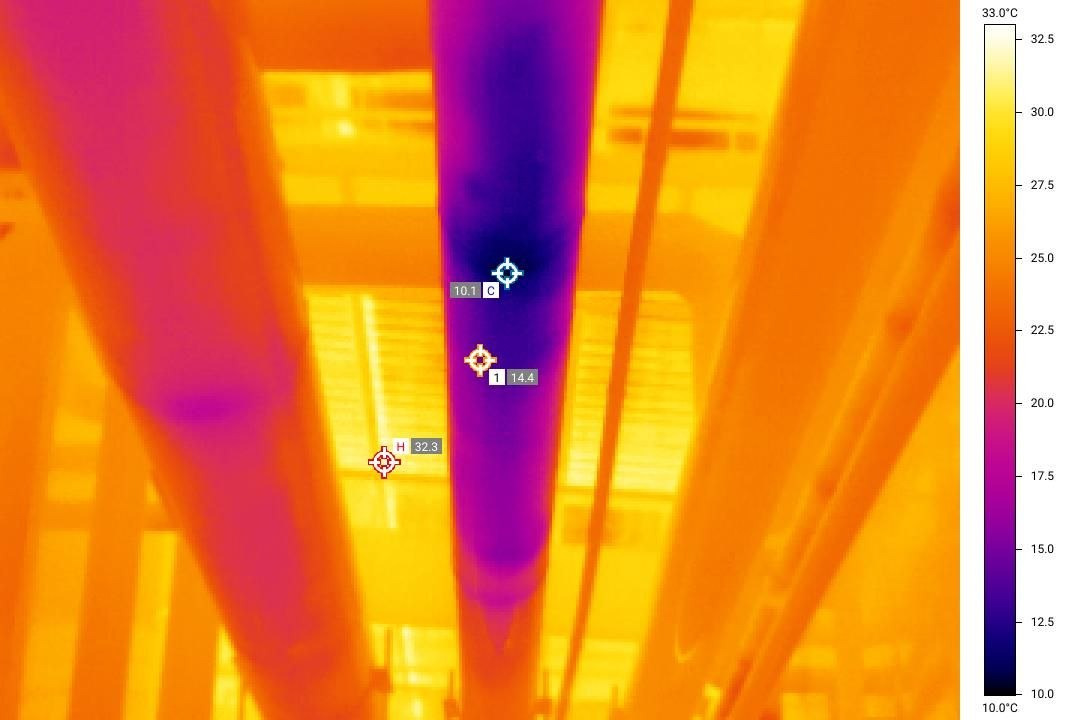
Cold store · suction headerRange 10.0 – 33.0°C
Move to scan
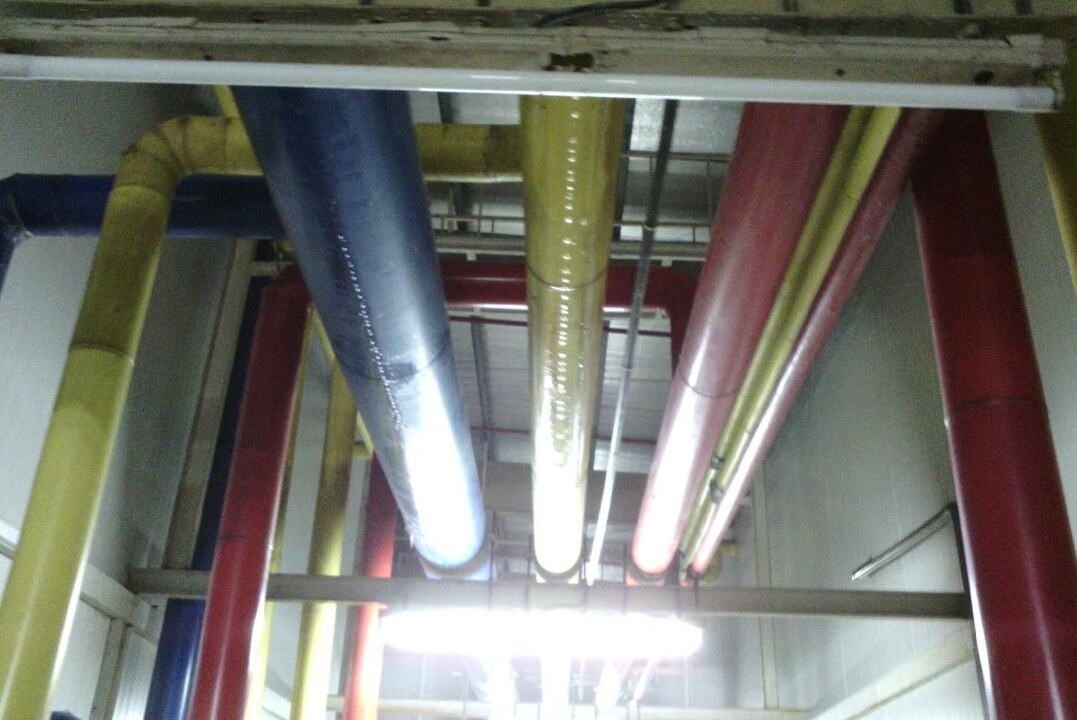
What you see: painted pipes on a ceiling.What the camera sees: a 22°C gradient bleeding into the room.
0%
Average electricity reduction
0mo
Typical payback period
0
Sites surveyed
0GWh
Annual energy saved
32.3°C · the problem
Three costs, one root cause: nobody is measuring.
Facilities are built once, commissioned once, and then run for a decade on assumptions. Everything below comes from the same gap.
The bill goes up. Nothing explains why.
A monthly invoice is one number for hundreds of loads. Without measurement there is no way to tell a genuine production increase from a compressor that has quietly started running twice as long as it needs to.
Typical hidden waste: 15–30% of the bill
Compressors wear out years early.
Short-cycling, high head pressure and high discharge temperatures are the three things that shorten a compressor's life. All three are usually caused by settings and controls, not by the machine itself.
An overhaul costs more than a year of monitoring
The failure you did not see coming.
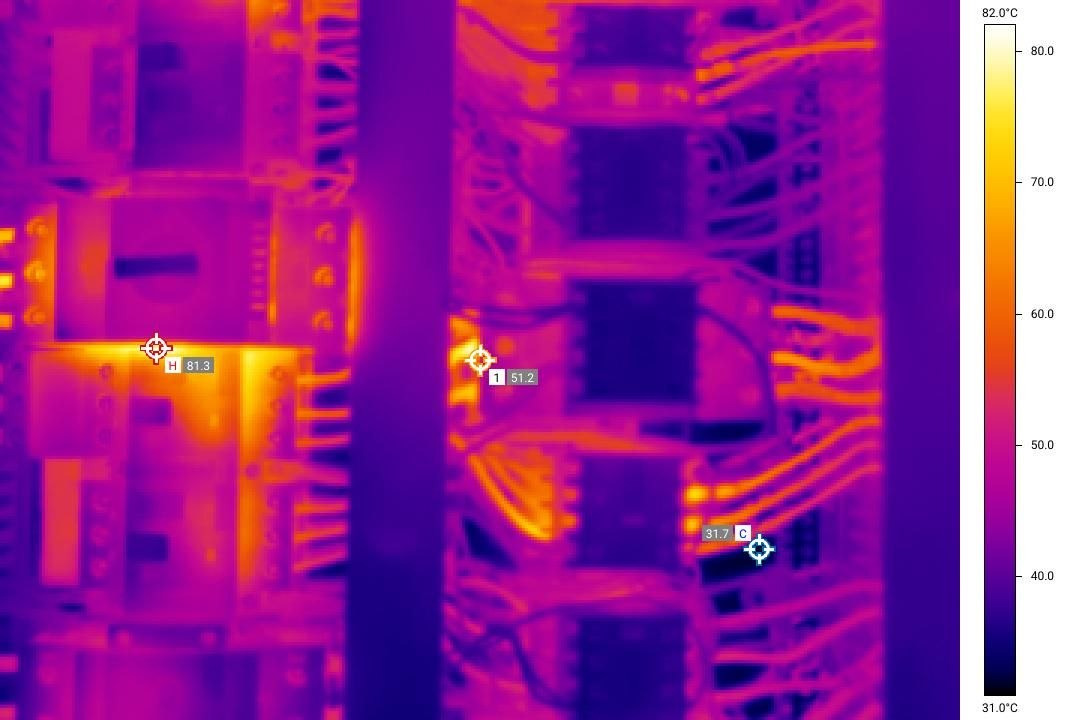
A loose termination in a panel runs at 80 °C for weeks before it lets go. When it does, it takes the line with it — and in a cold store, the stock in the chamber is on a clock from that moment.
One unplanned stop can exceed the annual energy saving
Estimate · 30 seconds, no email required
How much of your electricity bill is avoidable?
Four questions. The answer appears immediately — you decide afterwards whether you want us to verify it on site.
$
< 3 yr3–78–1515 yr +
Estimated avoidable spend
$—
Enter your monthly electricity bill to see an estimate.
Indicative only. It is built from the ranges we see across audited cold stores and food plants, not from your actual data.
The site assessment replaces it with measured numbers.
Method · measure, see, correct
Three stages. Each one produces something you can act on.
The order matters. Data tells us where to point the camera; the camera tells us which equipment to open up; the equipment is where the saving is actually made.
01
Real-time power monitoring
A meter-level view of every kilowatt-hour, so waste has nowhere to hide.
Non-invasive CT clamps on mains and per-feeder — no production stoppage
Load profiling at one-minute resolution across a full duty cycle
Power factor, harmonics and phase imbalance measurement
Peak-demand analysis against your tariff windows
You receive
You receive a load map showing exactly which asset consumes what, when, and how much of it is avoidable.
Setpoints, sequencing and control logic corrected for how the plant actually runs.
Suction and discharge pressure optimisation against real load
Floating head pressure and condenser fan control review
Compressor sequencing and staging to stop short-cycling
Defrost strategy: frequency, duration and termination method
You receive
Less runtime, fewer starts per hour, lower discharge temperatures — which is also the single biggest factor in how long a compressor lasts.
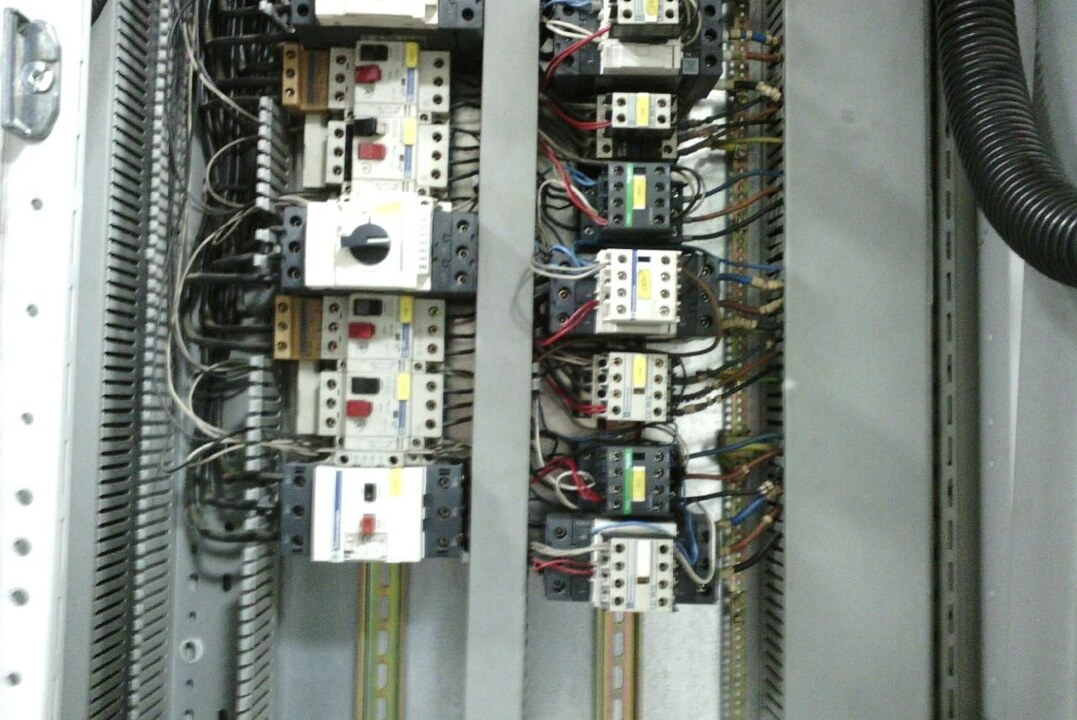
Drag the handle. On the left is what a walk-round inspection shows. On the right is what the plant was actually doing at that moment — a termination at 81 °C in a panel whose ambient was 31 °C.
InfraredVisible light
Tap a marker for the finding. Images are from CutWatt site surveys.
What a survey turns up on an average site
Every finding is logged with its radiometric image, its delta over ambient, and what it costs to leave alone.
+50 K
Electrical terminations
Loose connections and overloaded breakers. Energy loss is minor; the shutdown risk is not.
10.1°C
Uninsulated suction lines
A cold surface in a warm room is a continuous heat load your compressors pay for, around the clock.
Δ 6 K
Door seals and dock curtains
Infiltration at doorways is the single most common finding in cold storage, and the cheapest to fix.
Δ 12 K
Panel joints and roof interfaces
Degraded insulation shows as a thermal bridge long before it shows as condensation.
Δ 20 K
Motors, bearings and compressor housings
A bearing that runs hot is telling you its remaining life. We log the trend, not just the reading.
Metering stays on site after the audit. You get load per feeder, peak demand against your tariff
windows, and an alert the moment a machine starts drawing more than its own established baseline —
which is usually the first sign that something mechanical is going wrong.
One-minute resolution, on any browser or phone
Baseload isolation — what the site draws when nothing is running
Savings measured against your agreed baseline, not estimated
Compressor starts per hour tracked as a wear indicator
Cold store 2 · main incomerdemo data
Load now
284kW
Peak today
412kW
Power factor
0.91
vs baseline
−27%
14:20 — compressor 3 drawing 18% above its baseline
Night baseload down 31% since defrost schedule change
Results · measured, not estimated
What changed, and by how much.
Each figure is the difference between an agreed pre-work baseline and metered consumption afterwards, weather and production normalised.
Frozen food cold store
6,400 m³ · 4 compressors
−31%lower monthly consumption
Found
Compressors ran almost continuously through the night with no measurable load change. Suction line insulation had degraded across a 22 m run.
Done
Re-insulated the suction header, corrected head pressure control, rebuilt the defrost schedule and staged the compressors.
Compressor starts per hour dropped from 9 to 3.
Dairy processing plant
3 production lines · 24/5 operation
−19%lower annual energy cost
Found
Peak demand charges made up a third of the bill. Two panels showed terminations above 80 °C.
Done
Shifted CIP and chiller pull-down out of the peak window, corrected the hot terminations, balanced phases.
One panel fault caught before failure — avoided an unplanned line stop.
Meat & poultry cold chain
2 chambers · blast freezer
−24%lower consumption
Found
Door seals and a dock curtain were leaking; the blast freezer never reached setpoint on schedule.
Done
Sealed the envelope, corrected evaporator fan control and superheat, added door interlocks.
Pull-down time reduced by 40 minutes per batch.
Engagement · three ways to start
Work with us in whichever direction the risk should sit.
Every engagement begins the same way — an assessment. What differs is how long we stay and how we get paid.
Fixed fee
Baseline Audit
A one-off, full-site assessment. The right starting point for any facility.
One to three days on site
Metering on mains and major loads
Full thermal survey of envelope, plant and panels
Findings report with ranked actions and savings estimate
No. Metering uses non-invasive clamps and the thermal survey is contactless — in fact the plant must be running under normal load for the readings to mean anything. We work around your schedule, including night shifts.
One to three days on site depending on facility size, then five to seven working days to deliver the report. Monitoring installations that stay permanently take about half a day.
A load map of your site, every thermal finding with its radiometric image and temperature delta, a ranked action list with estimated saving and cost for each item, and a payback calculation. Nothing is left as a generic recommendation.
We are not tied to any manufacturer. A large share of the savings we find need no purchase at all — they are setpoints, schedules, control logic and insulation. Where hardware is genuinely justified, we say so and you buy it wherever you like.
Yes. Data stays on your dashboard, is never shared, and we will sign an NDA before the first site visit if you prefer.
Most compressor wear comes from short-cycling, high discharge temperatures and running against an unnecessarily high head pressure. Fixing those reduces starts per hour and thermal stress, which is exactly what determines overhaul intervals.
It has not happened yet on an unaudited site, but the Shared Savings model exists for precisely that reason — under it, no savings means no fee.
We travel to site. Tell us where the facility is and we will confirm scheduling and any travel arrangement in the first call.
Free · first assessment
Find out what your site is wasting.
Give us a phone number and a facility. We will spend twenty minutes on a call working out
whether there is enough on the table to be worth a site visit — and tell you honestly if there is not.
No cost and no obligation for the first assessment
NDA signed before the visit if you want one
We do not sell equipment, so the findings are not a sales list